
Excel & Power BI Blog
To subscribe to our Excel newsletter, please contact us.
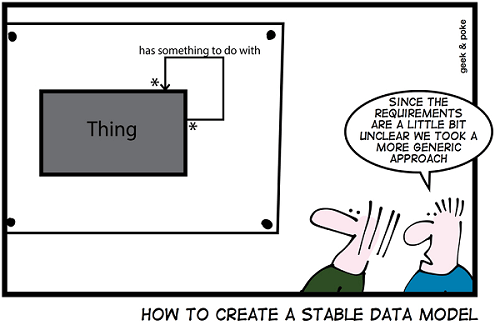
Data Shaping vs Data Modelling. What’s the difference?
Recently, during training sessions I’ve been asked several times what the difference is between data shaping and data modelling.
Briefly, data shaping is typically done in Power Query in Excel or Power BI. This is the process of extracting and transforming the data. Once complete, it can then be loaded into the data model. The process is commonly referred to as ETL (Extract, Transform & Load).
Once loaded, the data can then be modelled in one or more tables in Excel or Power BI. Modelling usually involves creating relationships with VLOOKUP in Excel or Manage Relationships in Power BI. It can also involve creating calculations, using formulas in Excel or the DAX language in Power BI.
Once the data has been modelled correctly it can then be analyzed and finally presented.

Office 2016 v Office 365 v Office Online – what’s the difference?
Understandably, there can be some confusion about all the different versions of Microsoft Office out there today. During training, people sometimes ask what’s the difference between Office 2016, 365 and Online and about the pricing. So, here’s a quick summary that I hope will help.
Buy or Rent?
Office 2016 is sold in the traditional way as a one-time purchase or license, so you pay a single, up-front cost to install the Office applications on your computer. One-time purchases don’t have an upgrade option, which means if you plan to upgrade to the next major release which is Office 2019, you'll have to buy it at full price.
Office 365 is a subscription service paid monthly or annually that ensures you always have the most up-to-date Office applications. Most of the Office 365 plans include the fully installed applications - currently Office 2016. However, when Office 2019 becomes available later this year, you will be able to install it at no extra cost.
To see which version works best for you and pricing, you can visit Microsoft’s website: https://products.office.com/en-gb/products
Freebies
Office Online is a completely free, web-based version of Office. If you’re happy using Microsoft Office through a web browser, you can use the web-based versions of Word, Excel, and PowerPoint. These are Office ‘Lite’ applications so you don’t have all the features you get in the paid versions. Plus, you can’t use them offline, so you must be connected. Here is a link to Office Online:
https://products.office.com/en/office-online/documents-spreadsheets-presentations-office-online
Talking of free versions, there are also Office mobile apps for phones and tablets. They’re available for Android, IOS and Windows mobile devices. Like Office Online, the free versions are Office ‘Lite’. If you are using these freebies and want all the features, you’ll need an Office 365 subscription. The mobile apps can be downloaded from Google Play, the App Store or Windows Store.
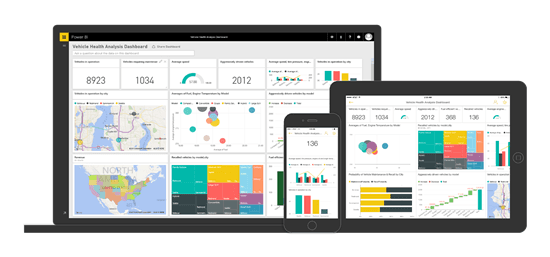
Microsoft Power BI: Produce stunning reports
Quickly transform your data into business intelligence that will help you find answers to your company’s most important questions.
With Power BI Desktop you can create rich, interactive reports and publish them to Power BI Online, so they can be shared anytime, anywhere. The rapid growth of Power BI can be attributed to its power, simplicity and flexibility. Data can be pulled in from a number of sources and it is not dependent on the version of Microsoft Office at your company. Plus, Microsoft Power BI Desktop and Power BI Online are free apps.
Media Tek will be running Power BI courses in Leeds, London and Manchester. Please see Power BI training for details.

Are you up to speed with Microsoft Excel?
Clearly, many of us are very busy in our daily working lives. Pressure brought on by time constraints, can be all too familiar in the office environment.
In Excel, we may be busy entering and verifying data in order to produce timely reports etc. But frequently, people aren’t aware of the big picture in Excel. By that, I mean features that can really save you time and boost productivity. Such as, Excels form tool for speedy data entry, creating simple time-saving macros, using styles to quickly format worksheets and charts. One of the comments I hear most often during training sessions is “This is going to save me so much time!”.
If what you learn in training, saves just 10 minutes per work day, that translates into a full working week per year!
Saving time, increasing efficiency, boosting productivity – interested?
Do You Have a Data Culture?
Without data, you're just another person with an opinion...W.Edwards Deming
During my career, I've been privileged to conduct training for hugely successful businesses who achieve incredible profits. Obviously, not all of us work for or are going to start up billion dollar companies. But there are things we can learn from them and implement, regardless of the size of our organization.
When you interact with these companies, you quickly realize that they will always strive to use the latest technology and that their staff will be trained to leverage that technology to the maximum. In other words, they have a data culture. This can even be something, such as adopting the latest versions of familiar apps like Microsoft Office.
So clearly, a data culture is all about working smarter, but here is how Microsoft define it: "A vision that can increase your business's value. That's because employees armed with data are known to make better decisions, improve customer experiences, and improve your bottom line."
Here are a few tips to foster a data culture:
Convert Data into Intelligence
These insights can come in the form of actionable intelligence. Microsoft now incorporates Business Intelligence tools right into applications such as Excel.
Make Data Everyone's Business
With the right tools, insights can come from anyone, anywhere, at any time.
Encourage professional development
In order to make employees more data literate, businesses can ramp up training about how data works, what it means, and what can be done with it, so that it can improve business profitability.
To quote Microsoft CEO Satya Nadella, "In a data culture, the entire effectiveness of an organization can elevate."

Had problems working with Excel on two monitors?
Excel's Single Document Interface can help
During training, I'm sometimes asked about opening different Excel workbooks on two monitors. My response is, that doing this in Excel 2010 can cause problems, as you have to open two instances of Excel. This can lead to issues executing functions and running macros.
However, there is a new feature built in to Excel 2013 called the Single Document Interface (SDI). This was developed to allow people to work with multiple workbooks on two monitors. You can now easily put one workbook on the left monitor and another on the right monitor. Both workbooks will be running in a single instance of Excel and each workbook has its own ribbon, formula bar etc. This increases functionality, so you can easily copy and paste and perform other operations between the two workbooks. Here are the steps:
Assuming you have the monitors set to 'Extend these displays' in the Display Control Panel.
Open Excel and the two workbooks.
Simply drag one workbook to the left monitor and the other to the right monitor.
As mentioned, each workbook has its own ribbon.
Note: You can also view two worksheets of the same workbook on two monitors. This is done by going to the View Tab/New Window and dragging each window accordingly.
Don't struggle with your data
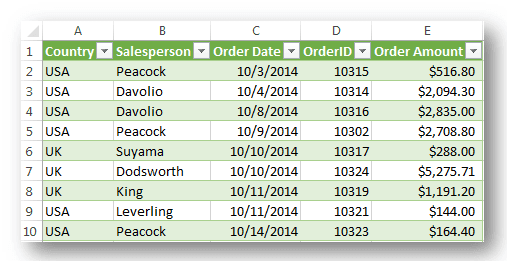
Quite often in Excel, I see people struggling to use pivot tables or grappling with over complicated formulas. Why is this? The number one reason, is that the data on the spreadsheet is in the wrong format. Wherever possible, Excel data should be formatted as tabular data. That is, in a table where each row represents one record and each column one field - as illustrated above.
When you start with this level of detail, it's then easy to summarise your data with pivot tables and any formulas should be relatively straightforward. So a simple concept - Excel was designed to work best with tabular data.
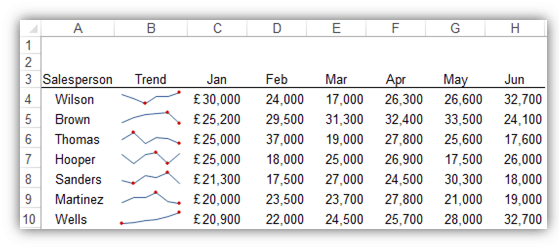
Excel Sparklines
Those of you who have attended Media Tek's training sessions will know that I'm always going on about making Excel more visual, which is in line with Microsoft's philosophy. Sparklines were introduced in Excel 2010 and are great for identifying trends rather than looking at a mass of numbers. As you can see above, they are being used to compare sales. The Sparklines are also showing the high point and low point for each salesperson. Because sparklines fit in a cell, they're ideal for use in Excel Dashboards too.
Creating Sparklines
The first thing you should do, is select the cell or cells you want them inserted into, then go to the Insert tab > choose the Sparkline type you want.
This will open the 'Create Sparklines' dialog box and you can select the range of cells containing the data for your Sparklines. There are 3 Sparkline types to choose from: Line, Column and Win/Loss.
Formatting Sparklines
When you click on a Sparkline it will activate the Sparkline Tools/ Design tab on the ribbon. Here you can edit the location and source data, add markers for various points and choose from pre-set Styles etc.
So there you go, Sparklines a quick and easy way to visualize your data in Excel.