
Microsoft Power BI: Visualising & Modelling Data
Course Outline
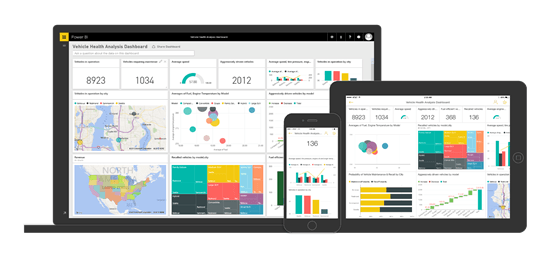
Take your reporting to the next level! This comprehensive introduction to Power BI will enable you to create visually rich, interactive reports and publish them to Power BI Online. You will also explore Power BI Desktop's powerful data modelling tools.
Prerequisites: Intermediate Excel or Database/BI experience.
| Exploring the Power BI Online Interface | Exploring Power BI Mobile |
| Quick Insights | Exploring the Power BI Desktop Interface |
| Q&A (Natural Language Queries) | Examining Data Sources |
| Importing Excel, CSV and PBIX Files | Understanding Data Types |
| Examining Other Forms of Data | Extracting Data with Query Editor |
| Understanding Data Refresh | Transforming Data with Query Editor |
| Creating a New Power BI Report | Loading Data |
| Utilising Visualisations | Understanding Relationships |
| Adding Filters to a Power BI Report | Merging, Grouping and Summarising Data |
| Utilising Slicers | Performing Calculations with DAX |
| Adding KPIs to a Report | |
| Creating a Power BI Dashboard | |
| Sharing Reports and Dashboards |
Competitive Pricing
This course lasts one day. See schedule
for upcoming dates.
Participants will receive a manual and completion certificate.